|
Delco-Remy Employment
Numbers
One of the common questions that always seems
to come up is: How many people used to work at Delco-Remy in
Anderson? While the numbers below are not complete or comprehensive,
they are do provide a good amount of data and information. Also
shown with the last chart below is that while the Anderson employment
numbers steadily declined over the years in 1992 the worldwide DR
employment was on the same level as what Anderson was at 20 years earlier.
Information provided by Bob Scharnowske.
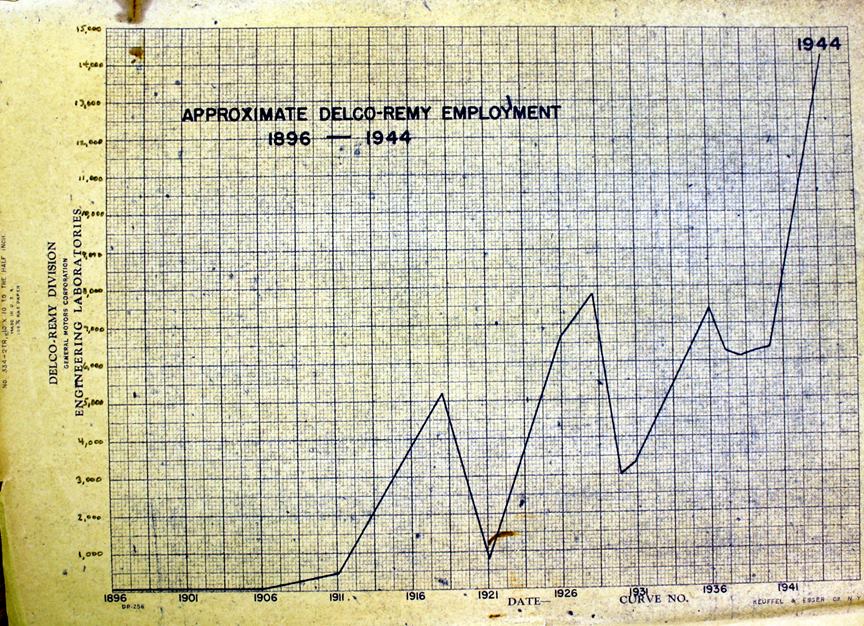
This is graph of employment from 1896 to
1944 and is courtesy of Bill Knepp/Madison County Historical Society.
Graph added 3-18-2016.
|
Anderson Complex
Average Employment Numbers - The numbers in black come from one
report provided by Bob Scharnowske dated 1-1989. Numbers in
red come from other documents.
Also missing from the
number of employed starting in the late 1970's and early 1980's is
the number of contract employees that started to be used to replace
salaried headcount as engineers, technicians, secretaries, clerks,
etc. One day a salaried engineer or other person would retire,
and the next day a contract employee, paid by an outside company
such as Manpower that was paid by DR, would be doing the job.
Sometimes it was the same person that retired the day before.
So the number of persons that were directly earning their living via
DR is higher than shown below. |
| Year |
Hourly |
Salary |
Total |
Comments |
| 1914 |
|
|
1,500 |
|
| 1922 |
|
|
970 & 1,165 |
Electric
World, Feb 18 & April 15, 1922 Issues |
| 1923 |
|
|
3,672 |
|
| 1926 |
|
|
4,497 |
|
| 1927 |
|
|
10,082 |
|
| 1940 |
9,143 |
965 |
10,108 |
|
| 1941 |
9,151 |
1,112 |
10,263 |
|
| 1942 |
15,199 |
1,514 |
16,713 |
Maximum
WWII Hourly Employment |
| 1943 |
14,876 |
2,177 |
17,053 |
Maximum
WWII Salary & Total Average Employment |
| 1944 |
11,671 |
2,089 |
13,760 |
|
| 1945 |
10,952 |
1,878 |
12,830 |
|
| 1946 |
14,082 |
1,581 |
15,663 |
|
| 1947 |
10,208 |
1,454 |
11,662 |
|
| 1948 |
10,819 |
1,450 |
12,269 |
|
| 1949 |
10,235 |
1,527 |
11,762 |
|
| 1950 |
13,021 |
1,601 |
14,662 |
|
| 1951 |
13,010 |
1,747 |
14,757 |
|
| 1952 |
13,481 |
1,878 |
15,359 |
|
| 1953 |
11,956 |
1,930 |
13,886 |
|
| 1954 |
13,171 |
1,863 |
15,034 |
|
| 1955 |
16,041 |
2,189 |
18,230 |
Maximum
Average Hourly & Total Employment |
| 1956 |
14,340 |
2,134 |
16,474 |
One of
the contributing factors to the drop in employment at DR between the
tow years is that hourly persons were now required to retire at age
68 and salary at age 65. |
| 1957 |
12,940 |
2,146 |
15,086 |
|
| 1958 |
11,929 |
2,121 |
14,050 |
|
| 1959 |
12,351 |
2,339 |
14,690 |
|
| 1960 |
12,218 |
2,458 |
14,676 |
|
| 1961 |
13,329 |
2,411 |
14,740 |
|
| 1962 |
13,140 |
2,487 |
15,627 |
|
| 1963 |
13,504 |
2,378 |
15,882 |
|
| 1964 |
14,290 |
2,440 |
16,730 |
|
| 1965 |
14,852 |
2,579 |
17,431 |
|
| 1966 |
15,284 |
2,592 |
17,876 |
|
| 1967 |
14,660 |
2,501 |
17,161 |
|
| 1968 |
14,302 |
2,506 |
16,808 |
|
| 1969 |
14,548 |
2,528 |
17,076 |
|
| 1970 |
14,161 |
2,373 |
16,534 |
|
| 1971 |
13,862 |
2,489 |
16,351 |
|
| 1972 |
13,857 |
2,544 |
16,401 |
|
| 1973 |
14,840 |
2,661 |
17,501 |
I became
part of the Salaried Headcount |
| 1974 |
|
|
|
|
| 1975 |
12,199 |
2,495 |
14,694 |
|
| 1976 |
12,766 |
2,576 |
15,342 |
|
| 1977 |
11,407 |
2,621 |
14,028 |
|
| 1978 |
11,511 |
2,673 |
14,184 |
|
| 1979 |
10,739 |
2,734 |
13,473 |
|
| 1980 |
8,125 |
2,411 |
10,536 |
|
| 1981 |
7,655 |
2,437 |
10,092 |
|
| 1982 |
5,890 |
2,263 |
8,153 |
|
| 1983 |
6,306 |
2,169 |
8,475 |
|
| 1984 |
7,363 |
2,332 |
9,695 |
|
| 1985 |
7,219 |
2,206 |
9,425 |
|
| 1986 |
6,697 |
2,222 |
8,919 |
|
| 1987 |
6,052 |
1,948 |
8,000 |
Total is
a rounded number, salaried is calculated and an estimate |
| 1988 |
5,844 |
1,586 |
7,700 |
Total is
a rounded number, salaried is calculated and an estimate |
| 1989 |
|
|
7,900 |
Total is
a rounded number |
| 1990 |
|
|
7,229 |
12-10-1990 |
| 1991 |
|
|
7,000 |
Total is
a rounded number |
| 1992 |
5,366 |
1,563 |
6,929 |
1-1-1992 |
| 1993 |
|
|
|
|
| 1994 |
|
|
|
Delco-Remy Div. of GMC ceases to exist. |
|
Anderson
Employment 1-1-1992 |
| |
Hourly |
Salary |
Total |
| Plant 1
and 18 |
793 |
1231 |
2,024 |
| Plant 3 |
817 |
49 |
866 |
| Plant
11 |
843 |
54 |
897 |
| Plant
16 |
387 |
32 |
419 |
| Plant
17 |
1,032 |
70 |
1,102 |
| Plant
19 |
246 |
16 |
262 |
| Plant
20 |
1,019 |
51 |
1,070 |
| Plant
38 |
32 |
10 |
42 |
| Plant
46 |
197 |
50 |
247 |
|
Total |
5,366 |
1,563 |
6,929 |
|
Delco-Remy Total Employment |
| |
12-10-1990 |
1-1-1992 |
|
Anderson, IN |
7,229 |
6,929 |
|
Indianapolis |
Apparently not counted or counted along with Plants 1 and 18. |
78 |
| Albany,
GA |
439 |
442 |
|
Anaheim, CA |
350 |
345 |
|
Chihuahua, Mexico |
1,029 |
1,238 |
|
Fitzgerald, GA |
351 |
385 |
| Paris
(Gennevilliers), France |
669 |
598 |
| Juarez,
Mexico |
1,461 |
2,203 |
| Laurel,
MS |
140 |
131 |
|
Meridian, MS |
570 |
660 |
| Muncie,
IN |
461 |
459 |
| New
Brunswick, NJ |
393 |
408 |
| Olathe,
KS |
419 |
427 |
| Oshawa,
ON Canada |
357 |
345 |
|
Piracicaba, Brazil |
177 |
298 |
|
Sarreguemines, France |
460 |
464 |
| Sexial,
Portugal |
31 |
71 |
|
Total |
14,696 |
15,481 |
|